Thursday, April 30, 2015

Linear Regression : Implementation using Normal Equation

Normal Equation: Intuition

Normal Equations is a method to solve for $\theta$ analytically.

The first step is to convert or represent the dataset in a Matrix and vector form.

Consider the dataset:


The variables here are the predictors ($x_1,x_2,x_3,x_4$) and the outcome $y$. The coefficients will be $\theta_0,\theta_1, \theta_2, \theta_3 and \theta_4$.

The hypothesis:
$h_\theta(x)=\theta_0x_0+\theta_1x_1+\theta_2x_2+\theta_3x_3+\theta_4x_4+\theta_5x_5$

Another column needs to be added for $x_0$ which will just be filled with 1's to make the dataset look like:


The matrix X will be denoted as:

$X = \pmatrix{1 & 2104 & 4 & 2 & 3 \cr
1 & 1400 & 2 & 1 & 5 \cr
1 & 3500 & 5 & 2 & 3 \cr
1 & 960 & 1 & 1 & 7 \cr
}$
$m$ x $(n+1)$

The matrix Y  will be denoted as
$Y = \pmatrix{1465 \cr 900 \cr 1000 \cr 435 \cr}$
m-dimensional vector

m training examples, (n+1) features

$\theta = (X^TX)^{-1}X^Ty$

When to use Normal Equation and when to use Gradient Descent:

The Gradient Descent algorithm needs an arbitary parameter $\alpha$ which is not needed in Normal Equations. Also, there is no need to do feature normalization in Normal Equation method. However, if the number of features are too large (n>10,000), Normal Equation method will be too slow because of difficulty in calculating the inverse of a very large matrix. Gradient Descent works well even if the number of features are in the order of ${10}^6$.


Wednesday, April 29, 2015

Linear Regression : Learning Rate

Linear Regression : Learning Rate

How to correctly choose the Learning Rate $\alpha$?

The correct value of $\alpha$ would make the Gradient Descent Algorithm to converge to a minima and the cost J will reach a minimum. If $\alpha$ is large, the algorithm may not converge, and if $\alpha$ is small, the algorithm will be very very slow. It can be shown mathematically that for a sufficiently small value of $\alpha$, the algorithm will always converge, though it may be slow.

The ideal way is to see the value of the cost function after few iterations, and see if the value of J is decreasing. For example, compare the values of J after 100, 200 and 300 iterations and see if it is decreasing (it should be, for the algorithm to converge). Ideally, declare convergence if the value of J is decreasing by less than $10^{-3}$ in subsequent steps.

To choose $\alpha$, try setting it to 0.001, 0.01, 0.1, 1, 10,100 and so on in the multiples of 10; or set $\alpha$ to  0.001, 0.003, 0.01, 0.03, 0.1, 0.3,1,3,10,30.... in multiples of 3


Cost Function : Multivariate Linear Regression

The concepts for calculating the cost function J, and estimating the parameters $\theta_0$ and $\theta_1$ can be easily extended to the case where we have multiple features in the dataset, i.e. instead of only one variable $x$ we have multiple variables $x_1, x_2, x_3...$ and so on.

Notations:

Consider a training dataset with 5 variables $x_1, x_2, x_3, x_4 and x_5$. The outcome variable is still $y$. There are $m$ examples in the dataset (number of rows)

$n$ = number of features
$x^{(i)}$ = input (features) of the $i^{th}$ training example
$x^{(i)}_j$ = value of feature $j$ in $i^{th}$ training example
Linear Regression : Multivariate [Multiple features]

Hypothesis:
Univariate: $h_{\theta}(x) = \theta_0 +\theta_1x$
Multivariate: $h_{\theta}(x) = \theta_0 +\theta_1x_1 + \theta_2x_2 +\theta_3x_3 +\theta_4x_4 ..... +\theta_nx_n  $

For convenience of notation, define $x_0$ =1

 $h_{\theta}(x) = \theta_0x_0 +\theta_1x_1 + \theta_2x_2 +\theta_3x_3 +\theta_4x_4 ..... +\theta_nx_n  $

The vector X contains $[x_0, x_1,x_2......x_n]$ and is a vector of dimension (n+1)
The vector $\theta$ contains $[\theta_0, \theta_1, \theta_2......\theta_n]$ and is a vector of dimension (n+1)

The hypothesis can be written as

$h_\theta(x) = \theta^TX$

Cost Function & Gradient Descent Algorithm for a Multivariate Linear Regression

Cost Function
$J(\theta_0,\theta_1,\theta_2.....\theta_n) = {\frac 1 {2m}}{\sum_{i=1}^m}{(h_\theta(x^{(i)})-y^{(i)})}^2$

Gradient Descent for $\theta_0,\theta_1,\theta_2....\theta_n$
repeat until convergence $\{$

$\theta_j : \theta_j-\alpha {\frac{1}{m}}\sum_{i=1}^m{({h_\theta}(x^{(i)})-y^{(i)})}.{x^{(i)}_j}$

$\}$ Simultaneously update $\theta_j$ for j= 0,1,....n


The value of $x_0$ is always 1, so this generalizes the Gradient Descent Algorithm for univariate as well as multivariate linear regression

Cost Function : Gradient Descent

Understanding the Gradient Descent Algorithm for minimizing the cost function of a Linear Regression Model

Gradient Descent is a generic algorithm which is used in many scenarios, apart from finding parameters to minimize a cost function in linear regression. Its a robust algorithm, though a little tricky to implement (as compared to other methods like a Normal Equation method). The generalization of the algorithm applies to univariate and multivariate models to find parameters $\theta_0, \theta_1,\theta_2,.....$ corresponding to the variables $x_0, x_1, x_2... etc$ to minimize the Cost Function $J_{\theta_0,\theta_1,...}$

More about the Cost Function : Understanding Linear Regression

Gradient Descent Algorithm :

Case: GD algorithm applied for minimizing $\theta_0 and \theta_1$. The same case can be generalized over multiple values of $\theta$

The Gradient Descent (GD) Algorithm works in the following way:

  1. Have some function $J(\theta_0,\theta_1)$
  2. Want to minimize $J_{\theta_0,\theta_1}$
  3. Outline:
    1. Start with some value of $\theta_0,\theta_1$
    2. Keep changing $\theta_0,\theta_1$ to reduce  $J(\theta_0,\theta_1)$ until we hopefully end at a minimum

The Gradient Descent starts on a point on the curve generated by plotting  $J(\theta_0,\theta_1)$, $\theta_0$ and $\theta_1$. It then takes a small step downwards to find a point where the value of J is lower than the original, and resets $\theta_0$ and $\theta_1$ to the new values. It again takes the step in the downward direction to find a lower cost function J and repeats the steps until we reach the local minima of the curve. The values of $\theta_0$ and $\theta_1$ can be found at this minimum value of J.

Key pointers:
  • How do we define how big a step we need to take in the downward direction? This is defined by the parameter $\alpha$ which is called the Learning Rate of the GD algorithm
  • The above curve shows there are two local minima. What if the GD algorithm reaches a local minima but the global minima is something else? The reason why GD algorithm works is because the curve in a Linear Regression model is a convex function with only one Global Minima, so irrespective of where you start, you will reach the Global Minima of the function  $J(\theta_0,\theta_1)$


Convex function:


Gradient Descent Algorithm: Pseudocode

repeat until convergence $\{$

$\theta_j := \theta_j - {\alpha}{\frac {\partial }{ \partial {\theta_j}}}{J(\theta_0,\theta_1)}$ for j=0 and j=1

$\}$

Simultaneously update both $\theta_0$ and $\theta_1$ i.e. don't plug the value of $\theta_0$ calculated in one step into the function J to calculate the value of $\theta_1$

The Learning Rate $\alpha$: This defines how fast an algorithm converges, i.e. are we taking a small step or a big step in moving to the next minimum value of J. If the value of $\alpha$ is too small, the steps will be small and the algorithm will be slow. If the value of $\alpha$ is large, the steps will be big and we might overshoot the minimum value of J.

Also, as we approach to a global minimum, the GD algorithm will automatically take smaller steps. Thus there is no need to readjust or decrease $\alpha$ over time.

The partial derivative function: This defines the slope of the curve at any given point ($\theta_0,\theta_1$). This could either be negative or positive, and will pull the values of $\theta_0 and \theta_1$ to the minima of the curve.


Application : Gradient Descent Algorithm for Linear Regression

Linear Regression Model: $h_{\theta}(x)={\theta_0}+{\theta_1}(x)$
Cost Function: $J(\theta_0,\theta_1)={\frac{1}{2m}}\sum_{i=1}^m{({h_\theta}(x^{(i)})-y^{(i)})}^2 $


Step 1: Calculate the partial derivatives of J w.r.t. $\theta_0  and  \theta_1$

j=0 : ${\frac {\partial}{\partial{\theta_0}}} J_{\theta_0,\theta_1}$ = ${\frac{1}{m}}\sum_{i=1}^m{({h_\theta}(x^{(i)})-y^{(i)})} $

j=1 : ${\frac {\partial}{\partial{\theta_1}}} J_{\theta_0,\theta_1}$ = ${\frac{1}{m}}\sum_{i=1}^m{({h_\theta}(x^{(i)})-y^{(i)})}.{x^{(i)}} $

This is simple partial differentiation, once with $\theta_0$ and again with $\theta_1$, keeping the other parameter constant. If you get it, good, and if you don't get it, it doesn't matter.

Step 2: The Gradient Descent Algorithm now becomes:

repeat until convergence $\{$

$\theta_0 : \theta_0 - \alpha{\frac{1}{m}}\sum_{i=1}^m{({h_\theta}(x^{(i)})-y^{(i)})}$

$\theta_1 : \theta_1-\alpha {\frac{1}{m}}\sum_{i=1}^m{({h_\theta}(x^{(i)})-y^{(i)})}.{x^{(i)}}$

$\}$ Update $\theta_0$ and $\theta_1$ simultaneously

Batch Gradient Descent:  Each step of gradient Descent uses all the training examples

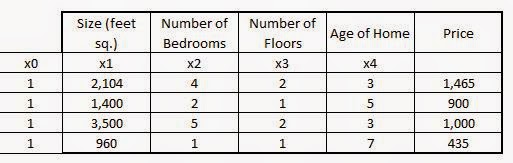
The Normal Equation Method: The exists a method in Linear Algebra where the concept of Metrices and Vectors are used to calculate the parameters $\theta_0$ and $\theta_1$ with iteration. This method is an efficient one, except in the case of very large datasets where it becomes computationally expensive due to the calculation of inverse of very large metrices.

To use the Normal Equation method of solving for $\theta_0$ and $\theta_1$ , the dataset has to be represented in a Matrix format.


Tuesday, April 28, 2015

Linear Regression : Understanding the Cost Function

Defining the Cost:

When we fit a regression line through an existing data, the line passes through the data and not all points will lie on the line (which will be the case for a perfect correlation between X and Y). There will be some points which are above the line and which are below the line.

The whole idea of regression is to fit the regression line such that the distance between the existing data points and the regression line is minimum (not the orthogonal distance, but the distance from the line measured in parallel to y axis as shown in the above figure). The points above the line would yield positive distance while the points below the line would yield negative distances.

The residual e is defined as $\hat {y_i}{-}{y_i}$

The errors are squared to eliminate negative values, and the Sum of Squared Erros (SSE) is minimized to obtain the coefficients of X in the equation $y=\theta_0+\theta_1{x}+e$

${SSE} = \sum_{i=1}^{m}{(\hat {y_i}{-}{y_i})}^2$

This method is known as Ordinary Least Squares (OLS)

The Hypothesis $h_\theta{(x)}$ is written as

 $h_{\theta}(x)={\theta_0}+{\theta_1}(x)$


The Cost Function (J) is typically written as
$J(\theta_0,\theta_1)={\frac{1}{2m}}\sum_{i=1}^m{({h_\theta}(x^{(i)})-y^{(i)})}^2 $

The goal of the regression analysis is to minimize the coefficients $\theta_0$ and $\theta_1$ for a univariate regression. For Multivariate, there will be multiple variables for X ($x_1,x_2,x_3..$) with their respective coefficients ($\theta_1, \theta_2, \theta_3....$.) The coefficient term $\theta_0$ is the constant term in this equation.
--------------------------------------------------------------------------------------------------
To summarize:
Hypothesis: $h_{\theta}(x)={\theta_0}+{\theta_1}(x)$
Parameters: $\theta_0,\theta_1$
Cost Function:

$J(\theta_0,\theta_1)={\frac{1}{2m}}\sum_{i=1}^m{({h_\theta}(x^{(i)})-y^{(i)})}^2 $

Goal: Minimize $J_{\theta_0,\theta_1}(\theta_0,\theta_1)$
--------------------------------------------------------------------------------------------------


Monday, April 27, 2015

Linear Regression : The Basics


Some Definitions of Linear Regression:
  • When a player plays well in the team, the team always wins. Given that the player in the next match has played well, its highly probable that the team will win again
  • Predicting the value of a variable by observing its relationship with another variable.
  • Wiki :  Linear Regression is an approach for modeling the relationship between a scalar dependent variable y and one or more explanatory variables (or independent variable) denoted X
  • Example: Price of a house is dependent on its area and number of bedrooms. Given the data about area of house and number of bedrooms (X: area(x1) & num_bedrooms(x2)) and their price (Y), find a relationship between Price of house and its area & number of bedrooms. Now, if you get a house's area and number of bedrooms, predict the price of tha house based on the historical data
All the above statements and examples are from the Supervised Learning paradigm of Machine Learning. They take some initial data, understand the pattern in it, and use the pattern on the new data to figure out the outcome


The Predictor variables (X) are known as predictors of independent variables, since they are independent and their values can change without being affected by any other variable

The Outcome Variable (Y) is known as dependent variable since its value is 'dependent' of the value of independent variables (X's), and if any of the X's change, the value of Y will have to change.

An equation is typically written as 

y: Outcome Variable
X: vector of Predictor variables (independent variables)
$\epsilon$: error term
$\beta$: Coefficient of the terms


Another way of representing the model is :

The Training Dataset goes into a learning model, which proposes a hypothesis 'h' which is used to take independent variables (X's) as input and produce a result (Outcome variable/Dependent Variable)

What is there is no relationship? Or how accurate is our model? How to measure it? What is the error term?  - All models come with a cost function which estimates the difference between the actual values of y's in the training data, and the gap with the prediction model. This gap between actual and estimated values of Ys is known as the Cost.

All optimization objectives are aimed at reducing the cost. Lesser the cost, better is the model (however there are other factors too).

Thursday, April 23, 2015

Machine Learning : Some Interesting Use Cases

Some Interesting Use Cases (there are many many many more)...


  • Identifying the pictures of humans from their and their friends on Facebook (automatic tagging)
  • Going through videos on YouTube and identifying the cat videos
  • Self Driven Cars
  • Email SPAM detection (a pretty standard problem)
  • Handwriting recognition
  • Understanding Music Genre
  • Recommendation Engine for Netflix and Amazon
  • ...and many more
Looks Interesting !! The possibilities are endless !!